| How to visualize a thematic map? |
| 1. Select the Indicators tab. |
 |
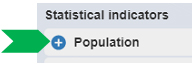
| 2. Open a statistical domain by clicking the plus button. |
 |
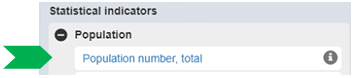
| 3. Select an indicator from the list of indicators by clicking on its name |
 |
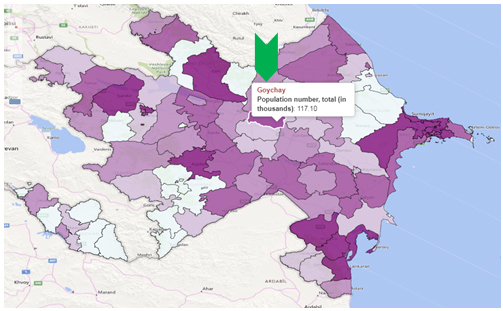
| By default the geographical level of districts of AZ and the last available year for statistical data are visualised in the map window. By default a legend with 5 coloured classes appears with classification method - Quantile. |
| 4. Explore the values of the chosen indicator while moving the cursor over the map or by clicking on the areas in the map window. |
 |
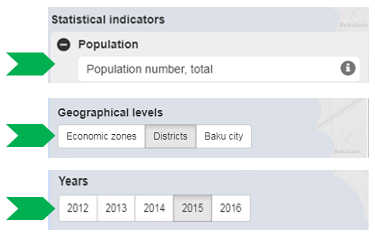
| 5. Change the statistical indicator, geographical level or the yearsby clicking on the related buttons. |
 |
| 6. To reset the selection click on the home button |
 |
| © 2017 This site is managed by the Department of Information Technologies of the State Statistical Committee of the Republic of Azerbaijan. |